Overview
LAN
Ping
Monitor
Port Scan
Traceroute
DNS
Wake on LAN
WhoIs
Info
Ports
Joe`s Network Diagnostic Analyzer Monitor Scanner and Security Utility Professional The network utility Network is the All-In-One tool to help you monitoring, troubleshooting andanalyzing your network. Each tool simply implements the best solution on the iPhone, iPad and iPodtouch.Now also with Apple Watch support. It currently consits of the following tool sets:vFeature overview: - The app has been completely rewritten from scratch to best support IOS 8 & 7 and upcoming features and for supporting all new iOS devices.- Native iPad support added.- The user interface has been completely redesigned now representing a lightweight IOS 8 look & feel as well as being used even more intuitively. All tools are being implemented the best way possible.- Separate Bookmark for different tools.- Super Bookmarks. Bookmarks defined within settings section which are being used if no entry was made- Wake on LAN Bookmarks have been enhanced too, so that they can now be used within different tools- Clipboard has been added to easily use and copy result among different tools.- On the fly settings for being able to changed the most important settings on the fly.- Most tools come with grouped history. For examle a Pings, Traces, DNS lookup history.- Email history results.- Define of number of packets to send and ttl to be used.- Set individual timeouts definitions.- Traceroute timeout values and maximum path length are adjustable.- Works via Wifi, 3G, EDGE, GPRS, VPN.- Arrange tool order and tool to run at startup to your own preference.- Import your ld bookmarks. If bookmarks of former version of the tool has been found they can be imported within the feature section of the tool. An organize button will be displayed in an apprearing toolbar.
TCP / UDP Ports
- list lots of well known ports
Settings
- adjust settings such as ttl to your needs
LAN Scanner
Analyze your local area network. See which devices are connected to it. Include information from the past showing new devices or devices not online anymore. Get more detailes information about devices such as when it was first or last seen. MAC address open ports, etc. Or just use it to easily create bookmarks from your networked devices which is extremely helpful when creating WOL bookmarks with MAC address information. Of course any information can be emailed.
Wake on LAN (WoL)
Device Info
- Device Status
- Network settings
WhoIs
- perform WhoIs lookups
Port Scanner
- secure your own network by testing open server ports
- define your own port presets being used for scanning
DNS lookup
- including DNS reverse lookup
Monitoring host groups
- monitor up/down times of important hosts
- scroll through the event history
Fast Traceroute
- optimized for fast path discovery
- including automatic reverse IP lookup of any IP address
Ping including:
- Ping ranges
- Host groups
- Broadcast pings


Tools
Server / Host Monitoring
Host Group Bookmark
LAN Scanner / Analyzer
LAN Scanner / Analyzer
LAN Scanner History
LAN Scanner Device Details
LAN Scanner Scanning options
Apple Watch Remote Control
Port Scanner
Port Scanner
Port Scanner Presets
Port Scan Preset Entry
Port Scanner Preset Editing
Port Scanner Preset Entry
Bookmark entry
Wake on LAN (WOL)
Bookmark entry . Wake on LAN
Bookmarks
Bookmarks editing
DNS lookup / reverse lookup
Ping and Ping Range
Ping / Host Group pinging
Ping Range
Port / Service name lookup
Settings
Trace / Traceroute
WhoIs
Wake on LAN
Device Info
Apple Watch Notification
Apple Watch Host Monitoring
Apple Watch Host Monitoring Detailed Notification
Mauris sit amet tortor.38
34 - 34
<
>
LAN Analyzer
LAN Analyzer allows you to scan your local network you are connected to via WiFi.
It shows any device answering to Ping requests listing their name, IP address, MAC address
and registered network interface vendor information.
The network gateway/router will be marked with the letter "G".
The green dot just marks that the device answered. It will mave a more significant meaning then the history mode is enabled..
The iOS device you are performing the scan with is marked with "Me".
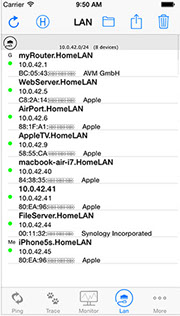
History disabled
By touching the H button in the menu bar you can enable the history mode. It includes history information from past scans and marks them either with a green, grey or blue dot .
History enabled
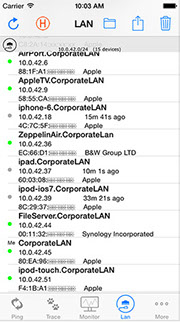
- green dot: had already been seen in the network before
and answered to ping in recent scan.
- grey dot: device had beed seen scanning the network
in the past but is currently not active
or not answering to pings anymore
- blue dot: device answered the ping and is new to
the network
By touching the device you can show more detailed information about it.
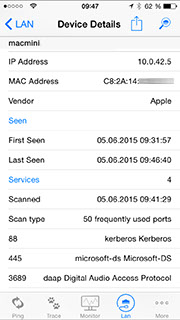
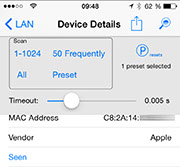
The scan button allows you to scan the device for open ports.
You can choose between most common scan methods or define and select your own scanning preset.
Ping
The Ping utility implements a ping application the iPhone way. Each ping session is being displayed logically grouped and each group is named after the ping destination.
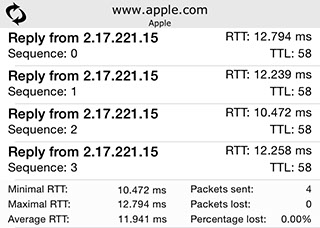
Each received Ping answer is being represented with table entries in the following clearly laid out way:
An entry shows
- from whom the reply was received
- the round trip time (RTT)
- the sequence number of the packet (Seq)
- the time to life (TTL) of the packet
A ping session can be stopped at any time by pressing the Pause button.
When a ping is being started a predefined number of ping packets are being send to the destination host. Each second one ping packet is being send. 2/4 in the Ping icon mean that ping 2 of 4 has been send.
If all pings have being send out the number changes into a (T) indicating that the application waits for the predefined timeout period for incoming ping answers. If all packages have been received before the time out is over the ping session finishes. The Stop button transfers into a start button again ready fort he next session to start. If a session has finished a summary entry is being added:
A summary entry displays:
- the minimum round trip time (Min RTT)
- the average round trip time (Average RTT)
- the maximum round trip time (Max RTT)
- number of packages being send (Send)
- number of packages no answer has been received (Lost)
- Percentage of answers received (Percentage)
During the entire time the application runs incoming ping answer packages are being accepted. Thus pings can be received after the predefined ping timeout. Pings which are being received with a Round trip time higher than the timeout value are marked with a red round trip time (RTT) value.
The number of pings being send can be configured in the applications preferences. As well as the timeout parameter.
History
Each ping session started will be added to the display thus creating a history. When you want to clear the history just touch the trash can button. It is only enabled if no ping session is running.
Super Bookmark
If no destination was entered and the „start“ (Play) button is being hit a so called super bookmark is being used. This super bookmark can be configured in the settings section.
Bookmarks
Just touch as the bookmarks icon to keep track of all your your hosts.
To add new hosts just touch the "+ Edit" button and touch the (+) icon in the appropriate section you want to add one.
Here you can also re-arrange the order of your bookmarks. Existing bookmarks can directly be accessed using the
disclosure button.
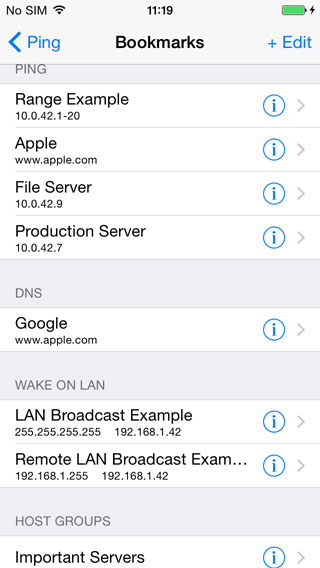
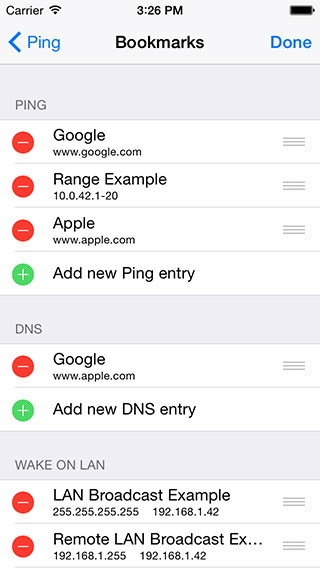
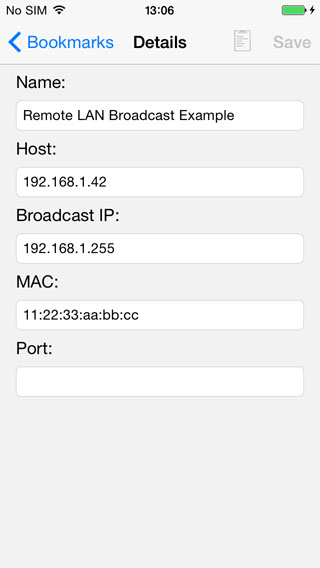
Depending on the bookmarks you are editing or adding the details of the bookmark entry vary.
And do not forget to touch save if changes are made.
Ping Ranges
The tool now supports ping ranges up to a /24. This gives you the possibility to find out responding hosts within a xssubnet.
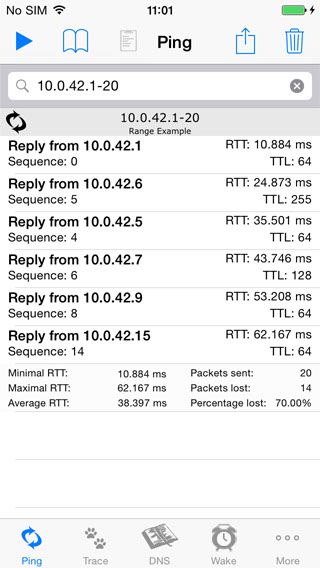
For example:
192.168.1.1-254
192.168.1.21-42
10.20.30.40-50
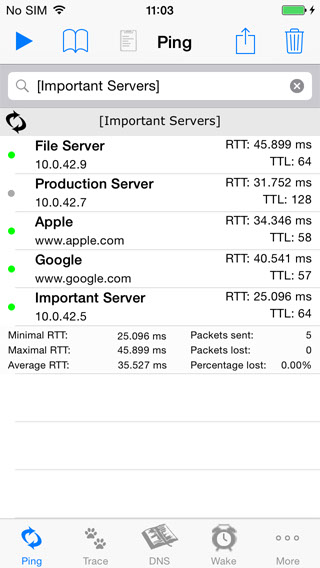
Ping Groups
Ping groups allow you to create groups of hosts. You now can for example create your WAN, LAN, printer, server ping groups or whatever ping group comes in your mind.
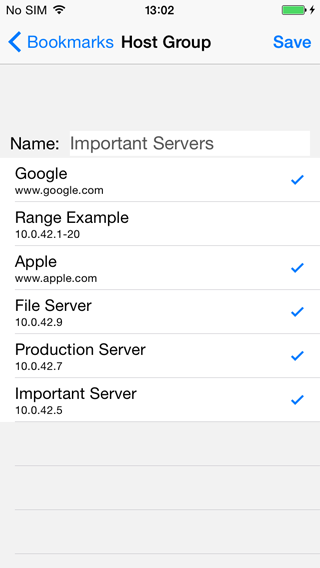
For this host can be selected from the Ping favorite section and associate them to your group. If selected and started all selected hosts are being fast pinged to quickly determine their rechability.
Ping groups must be selected from the bookmark section for usage. You cannot simply enter their name. When using a Ping group and it is being displayed in the input field as soon as the input field is being entered the input field is treated as a normal host entry again and not as Ping group anymore. A group can also consist of a ping range.
Monitor
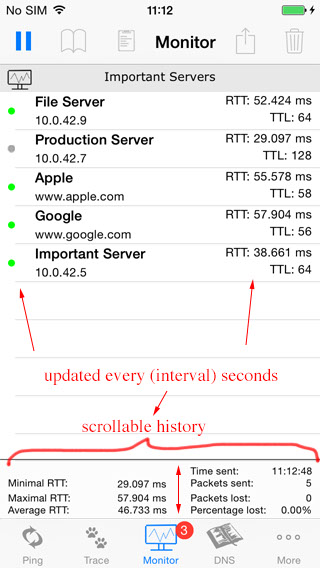
The Monitor tool allows you to monitor important hosts. It shows you whether a host is up and down and how fast it replies.
Furthermore it keeps a history of the summaries. We monitoring is stopped you can scroll through this list and see when a host went down and when it was up again. The history can also be emailed.
To monitor your hosts just select your desired group of host from your bookmark section. The interval in which pings are send to the host can be adjusted on the fly.
The Monitoring Tool offers special Apple Watch support. You are in an escalation meeting and immediately wanting to know when your important servers are up again. Create a Monitoring group on your iPhone first.
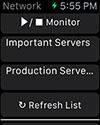
Afterwards you can select it and start monitoring from your apple watch.
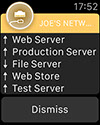
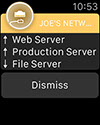
As soon as the monitored device up/down status changes you will get a notification.
This notification shows that 2 devices went up and 1 down.
Please note that the iPhone application must be running in the background to being able to receive notifications on your Apple Watch. The easiest way is to put the iPhone application in the background afterwards starting the monitoring session directly from you Apple Watch
Tap the notification to show more detailed information.
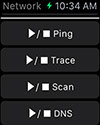
Beyond the monitoring tool the Apple watch also offers some remote control functionality for the network application. Some tools can be started and stopped using the Apple Watch.
How to use the Host Monitoring Tool:
1. select the monitoring tool
When it appears it does not know what to monitor and states „Please select Host Group Bookmark first"
2. select the bookmark icon in the top bar
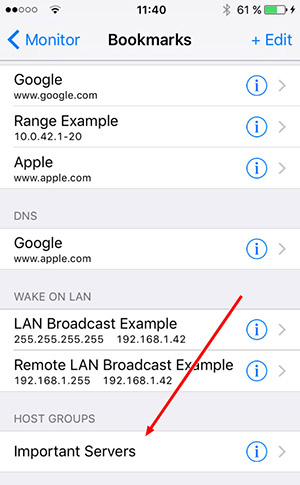
3. In the bookmarks menu scroll down to the host groups and select the host group you want to monitor (last entry in the example screen shot)
If you haven’t created one yet you have to first create one!
Host group entries use ping bookmarks!
3.1 If you want to create a host group entry you have to create a ping bookmark entry for each host you want to use first.
If you have ping bookmarks for each host you can start adding an new host group
3.2 select „+ Edit“ in the top menu bar
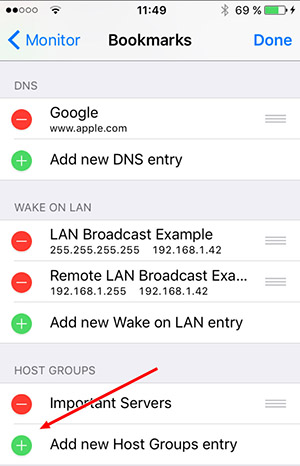
3.3 now you can add a new host group entry by touching the „+“ button within the Host Group Section
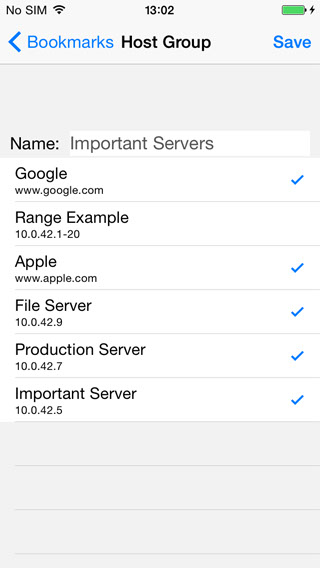
3.4 Having done so a new page appears where you can enter the name of the group
3.5 Below the name all ping bookmark entries are listed.
You can now selected or deselect entries from the list to add or remove them from the host group
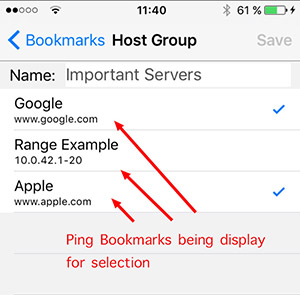
3.6 Afterwards select save and you return to the bookmarks menu
3.7 You can now select the new created Host Group Bookmark

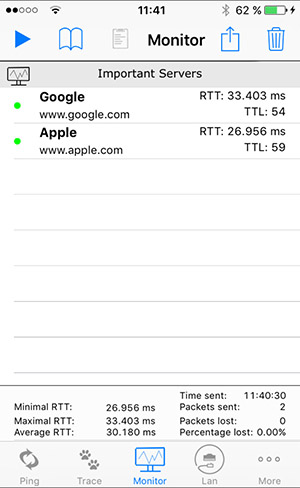
4. After having selected the ping group that you want to monitor the bookmarks will close and the monitor tool appears
5. The message „Please select Host Group Bookmark first“ should have been replaced with the name of the selected
host group bookmark.
6. you can now select the play button in the top to start monitoring.
Port Scanner
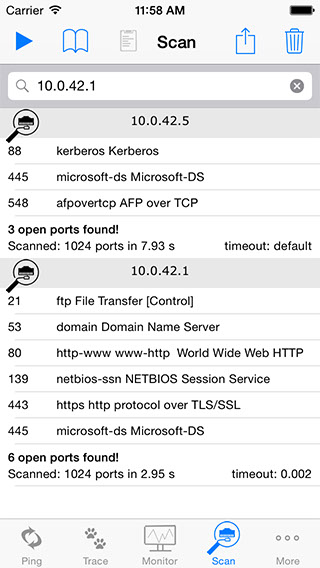
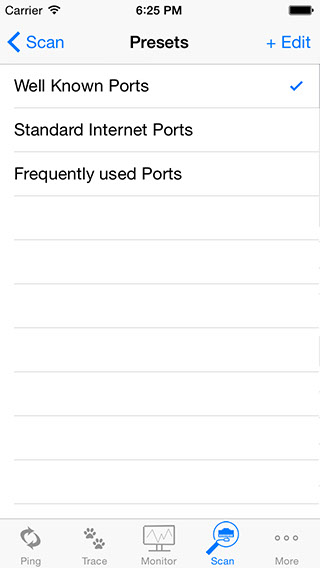
The Port Scanning tool allows you to secure your network by scanning for example servers or important devices for any open ports.
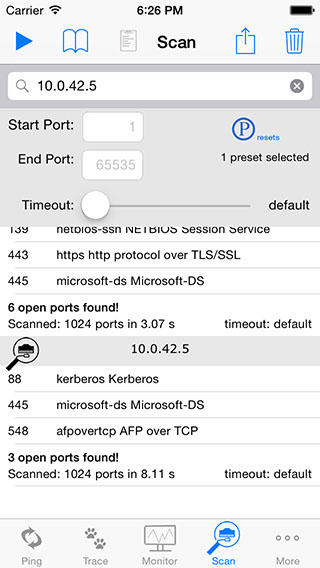
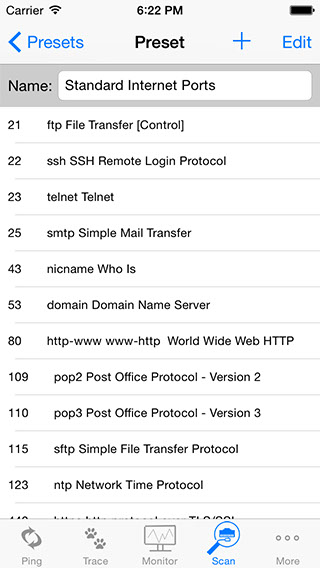
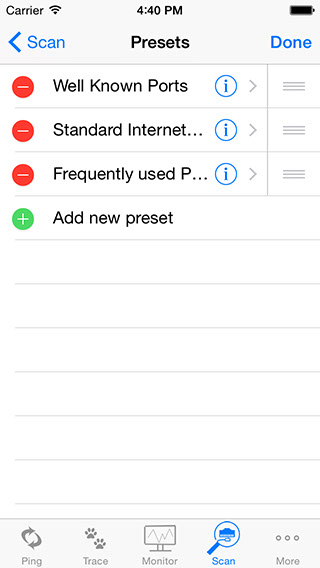
You can scan any desired port range, use predefines port presets or create your own presets.
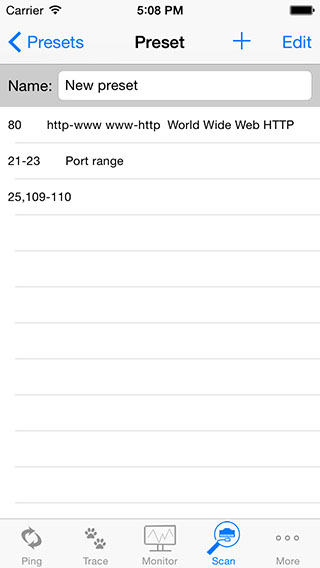
Presets can consists of
- single ports
- port ranges (e.g. 1-1024)
- comma separated port lists (e.g. 21,23,80)
list may include port ranges (e.g. 20-23,80)
Timeout can be adjusted to your needs for faster scanning. But be aware to shore timeouts may result in incorrect scan results. You should test what timeout values suits your own network needs.
Please note: when changing on the fly settings or entering new port entries the new input is accepted by hitting return button only.
Trace route
Traceroute determines the path to a destionation (if not prohibited by firewalls). Is has been impelemented for very fast (full version) path determination. And it automatically performs reverse lookups on any IP address in the path for better readablility and visualization.
When a trace is running two numbers are being displayed
The first number describes the hop that is actually being traced. And the second number (1-3) the ping which is being send to that hop. For each hop 3 pings are being send with the appropriate TTL.

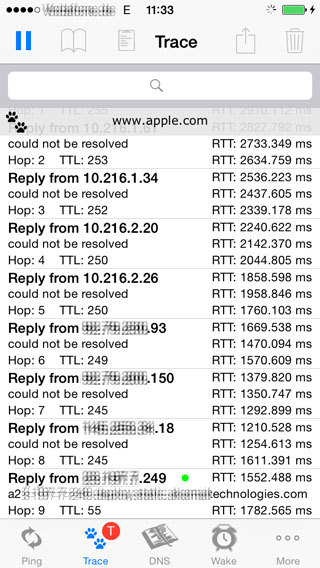
The green dot indicates that the
target host answered.
If a trace started and no results are being displayed despite of the fact that hop for hop is being testet this means that the first hop blocks every returning packet. In every case when a trace finishes either the destination reply is being shown or if the destination does not answer or in the case that his answer is being blocked an "unknwon hop to destination" message is displayed instead.
DNS
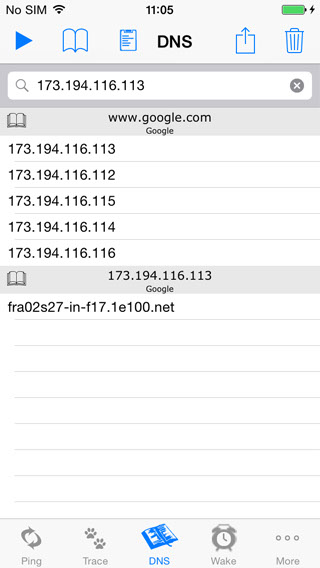
The Domain Name System application looks up either a given hostname displaying it's IP address (es) ,which were delivered by the currently used DNS servers of the device, or reverse looking up an IP address to a hostname.
It thus can be used if you need the IP address(es) of a given host's domain name. For example if you want to check your dynamic DNS IP of your home VPN gateway. Or if you want to check what name belongs to an given IP address. The usage of the DNS application is exactly as using the ping application. You can either enter the name to resolve directly or choose a destination from your favorites list.
Wake On LAN (WOL)
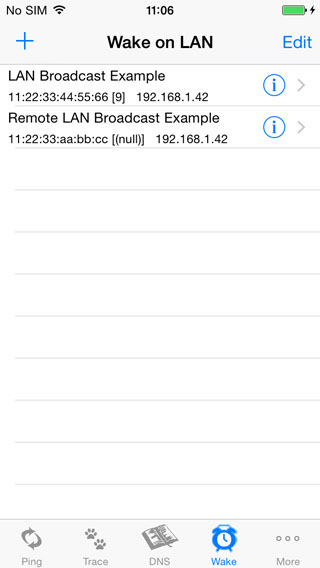
Wake on LAN is the application if you need to wake up one of your devices. Please be aware that the device to be woken up must be configured for Wake on LAN usage and thus must be listening to Wake on LAN magic packets for being woken up. How to configure your end devices for being woken up is not part of this tutorial. Please refer to your devices manufactures references.
The most important fields are:
- The host broadcast IP
This is the IP to which the address is to be send.
And it is important that it is a broadcast address and NOT the ip address since with the broadcast IP the
wake up paket can still reach the host even if the IP address has been timeouted in switch where the device
to be woken up is connected to.
- The MAC address
Configure the MAC address of the host to be woken up.
You do not need to enter any colon. They are added automatically.
- The port
If no port has been entered port 9 will be used.

WhoIs
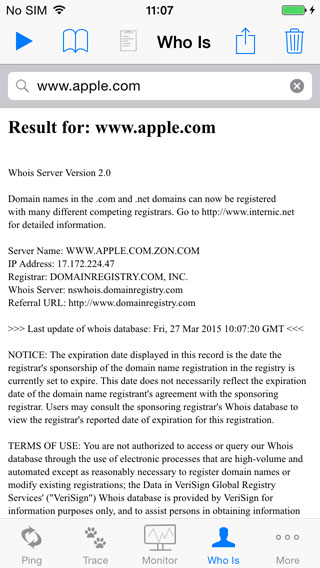
Give you the ability to perfom WhoIs lookups on your IOS device.
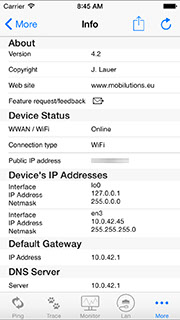
The Device Info
The Device Info sections show you current devices information such as:
- about / version information
- device status
- device's IP address settings
- device's interfaces
the device status displays the following information
- WWAN / WiFi status
The IP address info section shows the device's current active interface information and settings such as
- IP address
- network mask
- interface name
TCP / UDP Ports
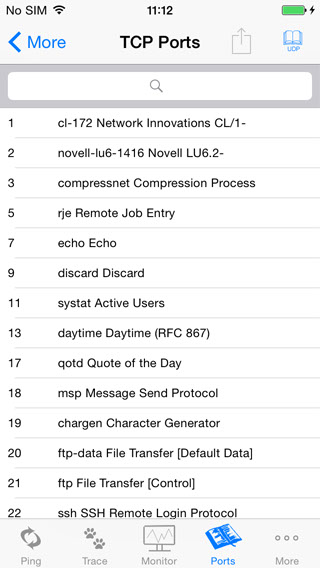
Give you the ability to lookup some well-known ports.
utions90.jpg)